Buy/Sell singal with RSI, MA, RSI DIV1. Overview
I'll explain a strategy that uses the simple but powerful technical analysis techniques RSI, MA, VOLUME, and RSI Divergence to identify Buy/Sell signals. This strategy utilizes Pine Script of TradingView.
Our strategy is based on four fundamental components.
- RSI (Relative Strength Index)
- MA (Moving Averages)
- Volume
- RSI Divergence
By using these four techniques together, we can find potential buy/sell signals.
2. Code Interpretation
To understand the TradingView code we used, let's examine each section one by one.
- RSI Calculation: RSI is a technical indicator that measures the relative strength of a price and is often used to identify overbought or oversold conditions. In our code, we calculate the RSI over a given period.
- Moving Averages: This code calculates short-term and long-term moving averages. Moving averages represent the average price over a specific period and are used to identify long-term price trends. Their intersections are considered potential buy/sell signals.
- RSI Divergence: RSI divergence represents a mismatch between the price trend and the RSI trend. It occurs when the price makes a new high or low, but the RSI does not. This indicates a weakening of the price trend and is considered a powerful signal of trend change.
- Volume Calculation: When the volume of transactions occurring during a specific period is x times more than the average volume, it is considered a signal of trend change.
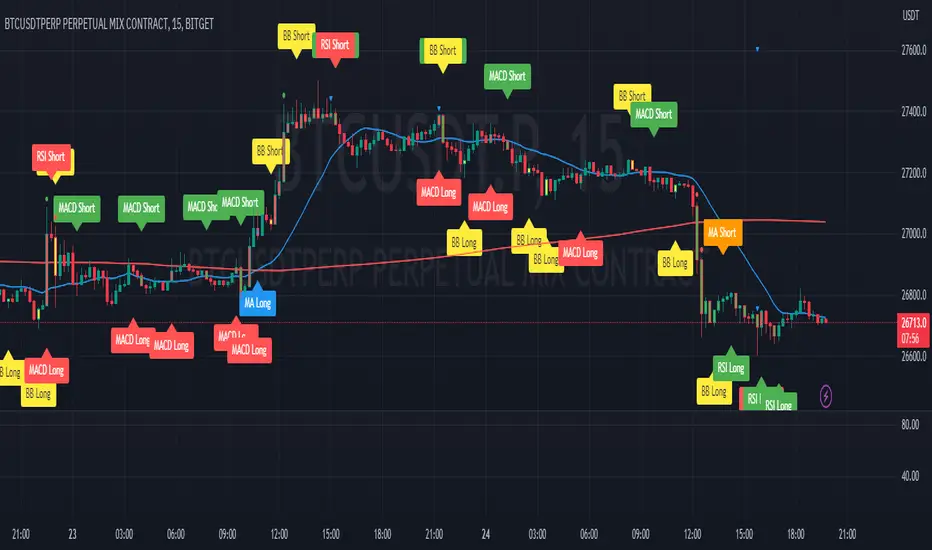
- Buy/Sell Signals: Each technical indicator generates buy or sell signals. These signals are marked as labels on the chart. In our strategy, buy/sell signals are generated when the RSI exits overbought or oversold zones, when the moving averages cross, and when RSI divergence occurs.
3. Signal Detection
3.1 Buy/Sell Signals Using RSI
The RSI indicator has a value between 0 and 100, with values over 70 generally considered the overbought zone and those under 30 as the oversold zone.
A buy signal is generated when the RSI rises from the oversold zone.
Conversely, a sell signal is generated when the RSI falls from the overbought zone.
3.2 Detecting Buy/Sell Signals Through Moving Average Crosses
Moving averages help identify price trends.
A buy signal is generated when the short-term moving average crosses the long-term moving average upward.
Conversely, a sell signal is generated when the short-term moving average crosses the long-term moving average downward.
The color of each bar can be changed according to each signal.
3.3 Detecting Signals When Volume is X Times Higher Than Average
When the volume is x times higher than average, a marker is placed above each bar.
A green marker is displayed when the buy volume is high.
A red marker is displayed when the sell volume is high.
4. Conclusion
This technical analysis strategy is very simple but effective. Using RSI, moving averages, volume, and RSI divergence, you can find effective buy/sell signals.
By leveraging Pine Script in TradingView, you can easily apply this strategy and find signals in real-time.
Always remember that risk management is important in trading. This strategy may not be effective in all market conditions, so always use appropriate risk management strategies alongside it.
----------------------------------------------------------------------------------------------------------------------------------------------------------------------------------------------------------------------------------------------------------------------------------------------
1. 개요
간단하지만 강력한 기술적 분석 전략인 RSI, MA, VOLUME, RSI Divergence를 사용한 Buy/Sell 신호 표시 전략에 대해 설명드리겠습니다.
이 전략은 트레이딩뷰의 Pine Script를 활용합니다.
우리의 전략은 다음 네 가지 기본 구성 요소에 기반합니다.
- RSI (Relative Strength Index)
- MA (Moving Averages)
- 거래량
- RSI Divergence
이 네 가지 기법을 함께 사용하여 잠재적인 매수/매도 신호를 찾아냅니다.
2. 코드 해석
우리가 사용한 트레이딩뷰 코드를 이해하기 위해 각 섹션을 하나씩 살펴보겠습니다.
RSI 계산: RSI는 가격의 상대적 강도를 측정하는 기술적 지표로, 과매수 또는 과매도 조건을 식별하는 데 자주 사용됩니다. 우리의 코드에서는 주어진 기간 동안의 RSI를 계산합니다.
이동평균: 이 코드에서는 단기 이동평균과 장기 이동평균을 계산합니다. 이동평균은 특정 기간 동안의 가격 평균을 나타내며, 가격의 장기적인 트렌드를 식별하는 데 사용됩니다. 이들의 교차점은 잠재적인 매수/매도 신호로 간주됩니다.
RSI Divergence: RSI 다이버전스는 가격 추세와 RSI 추세 사이의 불일치를 나타냅니다. 가격이 새로운 고점 또는 저점을 만들면서 RSI가 그렇지 않을 때 발생합니다. 이것은 가격 트렌드의 약화를 나타내며 강력한 트렌드 변화 신호로 간주됩니다.
VOLUME 계산 : 특정 구간동안의 평균 거래량보다 x배 이상 거래량이 많이 발생하였을때 트렌드 변화 신호로 간주됩니다.
매수/매도 신호: 각 기술적 지표는 매수 또는 매도 신호를 생성합니다. 이러한 신호는 차트에 라벨로 표시됩니다. 우리의 전략에서는 RSI가 과매도 또는 과매수 영역을 벗어날 때, 이동평균이 교차할 때, 그리고 RSI 다이버전스가 발생할 때 매수/매도 신호를 생성합니다.
3. 신호 감지
3.1 RSI를 활용한 매수/매도 신호
RSI 지표는 0에서 100 사이의 값을 가지며, 일반적으로 70 이상은 과매수 영역, 30 이하는 과매도 영역으로 간주됩니다.
과매도 영역에서 RSI가 상승하면 매수 신호가 생성됩니다.
반대로, 과매수 영역에서 RSI가 하락하면 매도 신호가 생성됩니다.
3.2 이동평균 교차로 매수/매도 신호 감지
이동평균은 가격의 트렌드를 식별하는 데 도움이 됩니다.
단기 이동평균이 장기 이동평균을 상승으로 교차하면 매수 신호가 생성됩니다.
반대로, 단기 이동평균이 장기 이동평균을 하락으로 교차하면 매도 신호가 생성됩니다.
각 신호에 따라 해당 봉의 색깔도 변경할 수 있습니다.
3.3 평균 거래량보다 x배 이상 거래량이 발생했을 때 신호 감지
평균 거래량보다 x배 이상 거래량이 발생했을 때 각 봉 위에 표시가 됩니다.
매수 거래량이 많을 경우 초록색으로 표시가 됩니다.
매도 거래량이 많을 경우 빨간색으로 표시가 됩니다.
* 모든 기준이 되는 수치와 색상은 설정에서 개인의 취향에 맞게 설정 가능합니다.
4. 결론
이 기술적 분석 전략은 매우 간단하지만 효과적입니다. RSI, 이동평균, 거래량, RSI 다이버전스를 사용하여 효과적인 매수/매도 신호를 찾을 수 있습니다.
트레이딩뷰의 Pine Script를 활용하여 이 전략을 쉽게 적용하고, 실시간으로 신호를 찾아낼 수 있습니다.
항상 거래에 있어서는 리스크 관리가 중요하다는 점을 명심하십시오. 이 전략이 모든 시장 상황에 효과적이지는 않을 수 있으므로, 항상 적절한 리스크 관리 전략을 함께 사용해야 합니다.
Komut dosyalarını "rsi divergence" için ara
Strength of Divergence Across Multiple IndicatorsOverview:
One-stop shop for all your divergence needs, including:
(1) A single metric for divergence strength across multiple indicators.
(2) Labels that make it easy to spot where the truly strong divergence is by showing the overall divergence strength value along with the number of divergent indicators. Hovering over the label shows a breakdown of each divergent indicator and its individual divergence strength value.
(3) Fully customizable, including inputs for pivot lengths, divergence types, and weights for every component of the divergence strength calculation. This allows you to quickly and easily optimize the output for any chart. Don't worry, the default settings will have you covered if you're not interested in what's going on under the hood.
The Divergence Strength Calculation:
The total divergence strength value is the sum of the divergence strengths of all indicators for which divergence was detected at a given bar. Each indicator's individual divergence strength is comprised of two basic components: (1) |ΔPrice| - the magnitude of the change in price over the divergence period (pivot-to-pivot), and (2) |ΔIndicator| - the magnitude of the change in indicator value over the divergence period.
Because different indicators' scales and volatility can vary greatly, the Δ values are expressed in terms of standard deviation to ensure that the values are meaningful and equitable across all indicators and assets/instruments/currency pairs, etc:
|ΔIndicator| = |indicator_value_1 - indicator_value_2| / 2 * StDev(indicator_series,100)
Calculation Weights:
All components of the calculation are weighted and can be modified on the Inputs page in settings (weights are simply multipliers). For example, if you think hidden divergence should carry less weight than regular divergence, you can assign it a lesser weight. Or if you think RSI divergence is worth more than OBV divergence, you can adjust their weights accordingly. List of weights:
Regular divergence weight - default = 1
Hidden divergence weight - default = 1
ΔPrice weight - default = 0.5 (multiplied by the ΔPrice component)
ΔIndicator weight - default = 1.5 (multiplied by the ΔIndicator component)
RSI weight - default = 1.1
OBV weight - default = 0.8
MACD weight - default = 0.9
STOCH weight - default = 0.9
Development for additional indicators is ongoing, as is research into the optimal weight configuration(s).
Other Inputs:
Pivot lengths - specify the number of bars before and after each pivot high/low to consider it a valid candidate for divergence.
Lookback bars and Lookback pivots - specify the number of bars or the number of pivots to look back across.
Price sources - specify separate price sources for bullish and bearish divergence
Display settings - specify how lines and labels should display, including which divergence strength values should show the largest labels. Include/exclude specific divergence types and indicators.
Please report any bugs, or let me know if you have any enhancement suggestions or requests for additional indicators.
@reees

MA Divergences for any indicatorThis is a mod of Tistas mod of the default RSI divergences.
www.tradingview.com
This is a SMA that can be applied to any indicator for divergence seeking. This can be useful if you use a custom indicator script and want divergences added, or for any oscillator really. Set the length to 1 and it will mirror the oscillator in question.

[astropark] Renko OBV divergencesDear Followers,
today a new great Scalper Tool , based on Ob Balance Volume (OBV) oscillator, which works from 1 minute timeframe Renko chart , which is the best and more secure timeframe to use on a Renko chart. But of course it works great on all timeframes (included the 1D timeframe), both on FOREX and on Cryptocurrencies!
This tool has some cool features:
it works on all timeframes , starting from 1 minute: so you can enjoy high-frequency trading by using a 24/7 running bot and a proper money and risk management strategy
it shows you both bullish and bearish divergences with a triangle up or down respectively
when it finds a strong bullish/bearish divergence , a flag will be displayed instead of a triangle
This script will let you set all notifications you may need in order to be alerted on each triggered divergence.
You may like to use it together with my Renko Scalper V2
and my Renko RSI Divergences indicator
On Bitmex/ByBit/Binance Bitcoin/USD chart best settings is Traditional Renko chart with 10$ box size, while 0.5$ box size is suggested on Ethereum/USD pair.
This is a premium indicator , so send me a private message in order to get access to this script.

Bull Bear Divergence IndicatorThe script is written for Constance Brown-like anayis with divergence signals between price and indicator (i.e. stock close / RSI divergence)
Note: Though the example here with NVDA shows good reversal predictions, best results generally are optained with un-normalized indicators and oscilators like CB#s comosite index.
(For Trading view written by LazyBear.) I use two different lines: an indi high line for baerish, and an indi low line for bullish divergences.
The script only shows divergences to pivot pairs next to each other, not between actual pivot and those "a few pivots ago"
For individual work, chose your indicator and replace rsi in line 10 with it, anything else is auto. Sript bottom: optional comparison lines addable.

RACZ-SIGNAL-V2.1RACZ-SIGNAL-V2.1 – Reactive Analytical Confluence Zones
Developed by: RACZ Trading
Indicator Type: Multi-Factor Confluence System
Overlay: Off (separate pane)
Purpose: Detect powerful trade opportunities through confluence of technical signals.
⸻
🔍 What is RACZ?
RACZ stands for Reactive Analytical Confluence Zones.
It’s a high-precision trading tool built for traders who rely on multi-signal confirmation, momentum alignment, and market structure awareness.
Rather than relying on a single technical metric, RACZ dynamically combines RSI, VWAP-RSI, Divergence, ADX, and Volume Analytics to produce a composite signal score from 0 to 12 — the higher the score, the stronger the signal.
⸻
🧠 How It Works – Core Components
1. RSI Analysis
• Detects momentum shifts.
• Compares RSI value to overbought (default: 67) and oversold (default: 33) thresholds.
• Adds points to Bullish or Bearish score.
2. VWAP-RSI
• Uses RSI based on VWAP (Volume Weighted Average Price).
• Adds weight to signals influenced by volume-adjusted price movement.
3. Divergence Detection
• Detects potential reversal zones.
• Bullish Divergence: RSI crosses up from low zone.
• Bearish Divergence: RSI crosses down from high zone.
• Strong confluence signal when present.
4. ADX Dynamic Strength Filter
• Custom-calculated ADX (trend strength indicator).
• Uses a dynamic threshold derived from SMA of ADX over a lookback period, scaled by a factor (default 0.9).
• Ensures signals are only validated in strong trend environments.
5. Volume Z-Score
• Detects anomalies in volume behavior.
• Z-score applied to 20-period volume average & deviation.
• Labels spikes, drops, high/low volume conditions.
⸻
📊 Signal Scoring Logic
Each component (RSI, VWAP-RSI, Divergence, ADX) can score up to 3 points each.
• Bullish Score: Total from bullish alignment of each factor.
• Bearish Score: Total from bearish alignment of each factor.
• Signal Power = max(bullish, bearish)
📈 Signal Interpretation
• BUY: Bullish Score > Bearish Score
• SELL: Bearish Score > Bullish Score
• NEUTRAL: Scores are equal
• Signal power is plotted on a 0–12 histogram:
• 0–5 = Weak
• 6–8 = Medium
• 9–12 = Strong (High Confluence Zone)
🖥️ Live Status Panel (Top-Right Corner)
This real-time panel helps you break down the signal:Component
Value Explanation: RSI / VWAP / DIV / ADX
Shows points contributing to signal
SIGNAL: Current market bias (BUY, SELL, NEUTRAL)
VOLUME: Volume classification (Spike, Drop, High, Low, Normal)
Color-coded for quick interpretation.
✅ How to Use
1. Look at Histogram: Bars ≥6 suggest valid setups, especially ≥9.
2. Confirm Panel Agreement: Check which components are supporting the signal.
3. Validate Volume: Unusual spikes/drops often precede strong moves.
4. Follow Direction: Use BUY/SELL signals aligned with signal power and trend.
⸻
⚙️ Customizable Inputs
• RSI period, overbought/oversold levels
• VWAP-RSI period
• ADX period and dynamic threshold settings
• Fully adjustable to fit any trading style
⸻
🚀 Why Choose RACZ?
• Clarity: Scores & signals derived from multiple tools, not just one.
• Confluence Logic: Designed for traders who look for confirmation across indicators.
• Speed: Real-time responsiveness to changing market dynamics.
• Volume Awareness: Integrated volume intelligence gives a deeper edge.
⸻
⚠️ Disclaimer
This indicator is intended strictly for educational and informational purposes only. It is not financial advice and should not be used to make actual investment decisions. Always conduct your own research or consult with a licensed financial advisor before trading or investing. Use of this script is at your own risk.

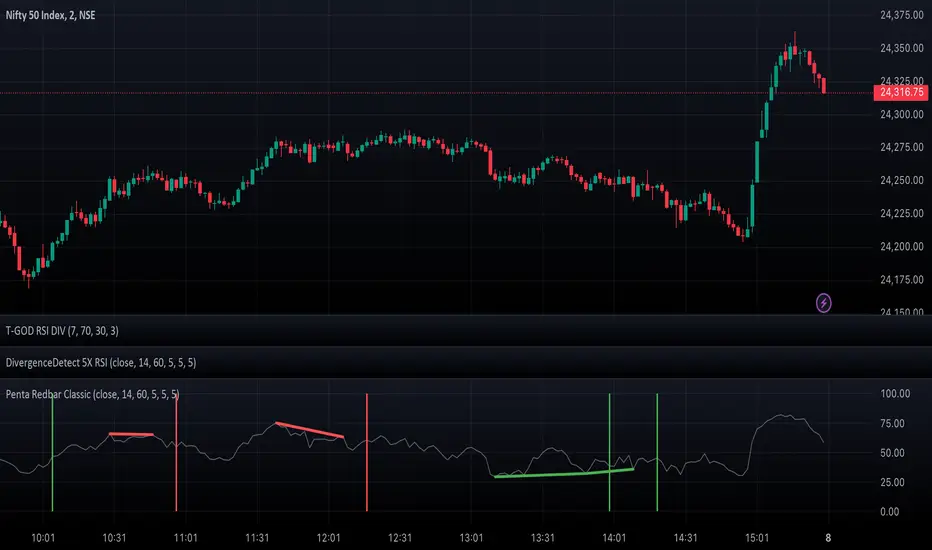
DivergenceDetect 5X RSIIntroducing the DivergenceDetect 5X RSI - a precision-engineered TradingView indicator tailored to spot RSI divergences over the span of the last 5 candles. Designed for both novice and professional traders, this tool aids in unveiling potential market reversals, providing timely alerts to guide your trading decisions. With its straightforward integration and user-friendly interface, staying a step ahead in the market has never been easier.
Feel free to adjust based on any additional features or specifics of your tool!
RSI Screener and Divergence [5ema]
Displayed on the RSI chart according to a custom timeframe.
Displays the RSI tracking table of various timeframes.
Identify normal divergence, hidden divergence on RSI chat.
Show buy and sell signals (strong, weak) on the board.
Send notifications when RSI has a buy or sell signal.
-----
I reused some functions, made by (i believe that):
©paaax : The table position function.
@everget : The RSI divergence function.
@QuantNomad : The function calculated value and array to show on table for input symbols.
I have commented in my code. Thanks so much!
-----
How it works:
1. Input :
input.int length of RSI => calculate RSI.
input.int upper/lower => checking RSI overbought/oversold.
input.int right bars / left bars => returns price of the pivot low & high point => checking divergence.
input.int range upper / lower bars => compare the low & high point => checking divergence.
input.timeframe => request.security another time frame.
input.string table position => display screener table.
2. Input bool:
plot RSI on chart.
Plot Regular Bullish divergence .
Regular Bearish divergence.
Hidden Bullish divergence .
Hidden Bearish divergence.
3. Basic calculated:
Make function for RSI , pivot low & high point of RSI and price.
Request.security that function for earch time frame.
Result RSI, Divergence.
4. Condition of signal:
Buy condition:
RSI oversold (1)
Bullish divergence (2).
=> Buy if (1) and (2), review buy (1) or (2).
Sell condition:
RSI overbought (3).
Bearish divergence (4).
=> Sell if (3) and (4), review sell (3) or (4).
5. Table screener:
Time frame.
RSI (green - oversold, red - overbought)
Divergence (⬈⬈ - regular bullish , ⬊⬊ regular bearish , ⬊ - hidden bullish , ⬈ - hidden bearish ).
Signal (🟢 - Buy, 🔴 - sell, green 〇 - review buy, red 〇 - review sell)
----
This indicator is for reference only, you need your own method and strategy.
If you have any questions, please let me know in the comments.

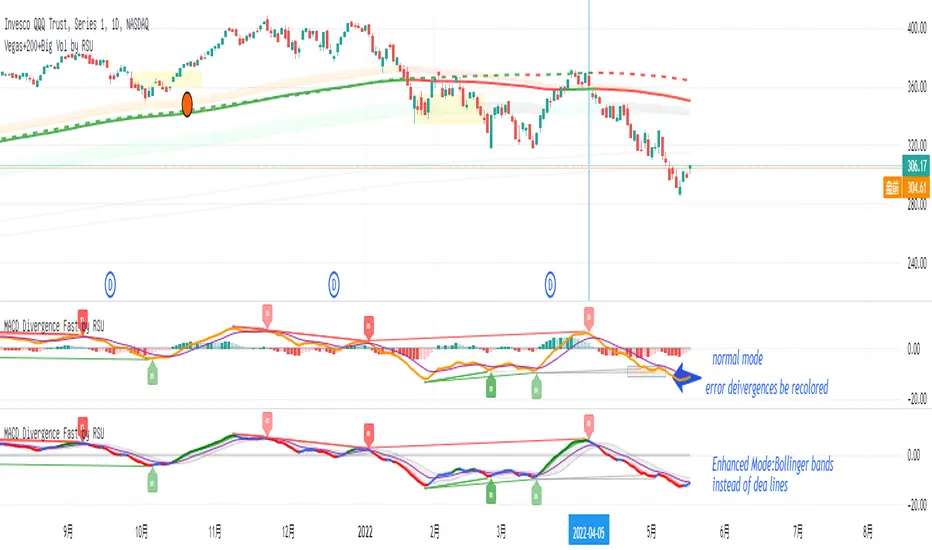
Divergence Macd+RSI Fast[RSU] -- No RepaintThis indicator combines the divergence of rsi and macd and displays it on the candlestick chart.
RSI:
1. When rsi is at a high point, once it falls by 1 k line, it will detect the divergence from the previous high point. This can quickly find the divergence that has taken effect and help you quickly capture the trend before a sharp decline or rise.
The difference between other RSI divergence indicators: the official divergence indicator is to detect the 5 and the k line, which may lead to a large amount of decline.
2. This indicator detects the previous high and the previous low of 5, 10, 20 lengths at the same time, instead of only detecting a fixed length, so that more deviations can be found.
MACD:
1. When MACD-diff line(orange color) is at a high point, once it falls by 1 k line, it will detect the divergence from the previous high point. This can quickly find the divergence that has taken effect and help you quickly capture the trend before a sharp decline or rise.
2. This indicator detects the previous high and the previous low of 5, 10, 20, 40 , 60 lengths at the same time, instead of only detecting a fixed length, so that more divergences can be found.
Notice:
Because it is a quick divergence detection, it is recommended to confirm that the divergence takes effect after the current k is completely closed first. I have identified this state in the indicator as "k not end".
Disadvantages and Risks:
Since it is a quick discovery, there will be error identification. Error divergences will recolor to grey.
Suggestion:
Use Alert catching divergence occurrences.
Please do not:
Don't go short in the uptrend, don't go long in the downtrend.
Top divergences that occur because of a strong uptrend are usually only temporary pullbacks. Bottom divergences in persistent declines are also temporary rallies. Do not attempt to trade such low-return trades.
It is recommended to use the divergence indicator when the stock price has made a new high and retraced, and once again made a new high, because this often leads to the end of the trend.
Divergence how to use:
1. After the previous candlestick was completely closed, a bottom divergence was found.
2. Open an long order at the beginning of the second bar, or as close to the bottom as possible (because the stop loss will be smaller).
3. Break the stop loss price below the previous low where the divergence occurred, which already means that the divergence is wrong.

[astropark] Renko RSI divergencesDear Followers,
today a new great Scalper Tool , which works excellent from 1 minute timeframe Renko chart , which is the best and more secure timeframe to use on a Renko chart. But of course it works great on all timeframes (included the 1D timeframe)!
This tool has some cool features:
it works on all timeframes , starting from 1 minute: so you can enjoy high-frequency trading by using a 24/7 running bot and a proper money and risk management strategy;
it shows you both bullish and bearish divergences with a triangle up or down respectively
when it finds a strong bullish/bearish divergence , a flag will be displayed instead of a triangle
This script will let you set all notifications you may need in order to be alerted on each triggered divergence.
You may like to use it together with my Renko Scalper V2
On Bitmex/ByBit/Binance Bitcoin/USD chart best settings is Traditional Renko chart with 10$ box size, while 0.5$ box size is suggested on Ethereum/USD pair.
This is a premium indicator , so send me a private message in order to get access to this script.

Kzx | RSI + Div + MACDComponents Description:
Relative Strength Index (RSI):
Purpose: Measures the magnitude of recent price changes to evaluate overbought or oversold conditions in the price of a stock or other asset.
Implementation: The script allows users to set the length of the RSI calculation and defines overbought and oversold levels, which can be visually represented on the chart. Additional features include options to fill and/or color the background of the chart when overbought or oversold levels are reached.
Divergence (Div):
Purpose: Identifies instances where the price of an asset is moving in the opposite direction of a momentum indicator, such as the RSI in this script. Divergences can signal potential trend reversals.
Implementation: The script provides options for users to define the conditions under which divergences are identified, including the source of price tops/bottoms, detection limits, and the maximum lookback period for divergence analysis. It visually highlights these divergences on the chart.
Moving Average Convergence Divergence (MACD):
Purpose: Tracks the relationship between two moving averages of a security's price. The MACD is used to identify trend direction, momentum, and potential reversal points through crossovers.
Implementation: The script calculates the MACD line and its signal line. It plots buy or sell markers based on crossovers between these two lines, indicating potential entry or exit points.
Script Category:
Category: Technical Analysis / Indicators and Strategies
Subcategory: Oscillators (for RSI and MACD) and Trend Analysis (for Divergence)
Usage:
The script is designed for traders and analysts who rely on technical analysis to make informed decisions in the financial markets. By integrating RSI, divergence detection, and MACD analysis into a single script, users can gain a more nuanced understanding of market conditions, potentially improving their trading strategies.
Customization and Visualization:
Users can customize various parameters, including lengths for RSI and MACD, overbought/oversold levels, divergence detection criteria, and visual aspects like colors and marker sizes.
The script provides visual cues directly on the price chart, making it easy to spot potential buy/sell signals, overbought/oversold conditions, and divergences without the need to switch between different indicators.

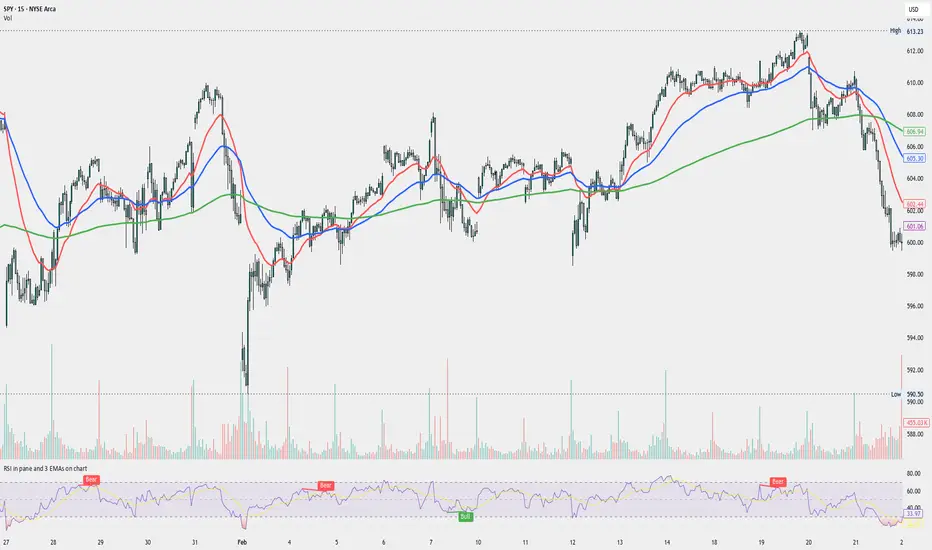
RSI in pane and 3 EMAs on chartCustom RSI in Pane + 3 EMAs on Chart — with Optional RSI Divergence Detection
Combines RSI in a separate pane with 3 EMAs on the chart and optional RSI-based divergence detection. Useful for analyzing both momentum and trend structure.
Features
RSI Pane
Custom RSI calculation (not built-in ta.rsi) with adjustable source and length
Overlay optional moving average (SMA, EMA, SMMA/RMA, WMA, VWMA, or Bollinger Bands) Overbought/oversold gradient fill for visual clarity (70 / 30 zones)
Midline (50) for neutral RSI territory
RSI Divergence Detection
Optional: toggle on/off with one input
Regular Bullish Divergence : Price makes a lower low, RSI makes a higher low
Regular Bearish Divergence : Price makes a higher high, RSI makes a lower high
Customizable lookback for pivot detection
Visual markers and labels plotted on RSI
Built-in alert conditions for both divergence types
3 EMA Trend Indicators on Price Chart
Three customizable EMAs (default: 20, 50, 200)
Color-coded and clearly plotted on main chart
Use to determine short/mid/long-term trend bias
No repainting or smoothing artifacts
Why use this script?
Gives a full view of trend + momentum without cluttering the main price chart, and it helps confirm entries and exits by observing RSI behavior alongside EMAs. The optional divergence detection can act as a signal for potential exhaustion or reversal (not entry signals on their own). It is a Good fit for traders who use RSI zones, divergences, and EMA structure in their decision-making, both for intra-day and swing trades (where it performs best).
How to use
Add this script to your chart. EMAs will appear on the main price chart; RSI and divergence will appear in a separate pane.
Adjust RSI and MA settings to fit your trading style (e.g., fast RSI for scalping, slower for swing)
Enable "Show Divergence" if you want visual alerts and markers
Use alerts to get notified when a divergence occurs without watching the chart
Always check the divergences on different time frames to validate the setup, and do not consider them valid on small time frames (<15 minutes).
Built for traders who want both momentum and trend context in a single tool — without clutter, repainting, or noise. I created this script to streamline my own analysis and avoid switching between multiple indicators. It's not meant to be a "signal generator" but a visual assistant for making better decisions. If you find it useful or have feedback, feel free to reach out.
MACD, ADX & RSI -> for altcoins# MACD + ADX + RSI Combined Indicator
## Overview
This advanced technical analysis tool combines three powerful indicators (MACD, ADX, and RSI) into a single view, providing a comprehensive analysis of trend, momentum, and divergence signals. The indicator is designed to help traders identify potential trading opportunities by analyzing multiple aspects of price action simultaneously.
## Components
### 1. MACD (Moving Average Convergence Divergence)
- **Purpose**: Identifies trend direction and momentum
- **Components**:
- Fast EMA (default: 12 periods)
- Slow EMA (default: 26 periods)
- Signal Line (default: 9 periods)
- Histogram showing the difference between MACD and Signal line
- **Visual**:
- Blue line: MACD line
- Orange line: Signal line
- Green/Red histogram: MACD histogram
- **Interpretation**:
- Histogram color changes indicate potential trend shifts
- Crossovers between MACD and Signal lines suggest entry/exit points
### 2. ADX (Average Directional Index)
- **Purpose**: Measures trend strength and direction
- **Components**:
- ADX line (default threshold: 20)
- DI+ (Positive Directional Indicator)
- DI- (Negative Directional Indicator)
- **Visual**:
- Navy blue line: ADX
- Green line: DI+
- Red line: DI-
- **Interpretation**:
- ADX > 20 indicates a strong trend
- DI+ crossing above DI- suggests bullish momentum
- DI- crossing above DI+ suggests bearish momentum
### 3. RSI (Relative Strength Index)
- **Purpose**: Identifies overbought/oversold conditions and divergences
- **Components**:
- RSI line (default: 14 periods)
- Divergence detection
- **Visual**:
- Purple line: RSI
- Horizontal lines at 70 (overbought) and 30 (oversold)
- Divergence labels ("Bull" and "Bear")
- **Interpretation**:
- RSI > 70: Potentially overbought
- RSI < 30: Potentially oversold
- Bullish/Bearish divergences indicate potential trend reversals
## Alert System
The indicator includes several automated alerts:
1. **MACD Alerts**:
- Rising to falling histogram transitions
- Falling to rising histogram transitions
2. **RSI Divergence Alerts**:
- Bullish divergence formations
- Bearish divergence formations
3. **ADX Trend Alerts**:
- Strong trend development (ADX crossing threshold)
- DI+ crossing above DI- (bullish)
- DI- crossing above DI+ (bearish)
## Settings Customization
All components can be fine-tuned through the settings panel:
### MACD Settings
- Fast Length
- Slow Length
- Signal Smoothing
- Source
- MA Type options (SMA/EMA)
### ADX Settings
- Length
- Threshold level
### RSI Settings
- RSI Length
- Source
- Divergence calculation toggle
## Usage Guidelines
### Entry Signals
Strong entry signals typically occur when multiple components align:
1. MACD histogram color change
2. ADX showing strong trend (>20)
3. RSI showing divergence or leaving oversold/overbought zones
### Exit Signals
Consider exits when:
1. MACD crosses signal line in opposite direction
2. ADX shows weakening trend
3. RSI reaches extreme levels with divergence
### Risk Management
- Use the indicator as part of a complete trading strategy
- Combine with price action and support/resistance levels
- Consider multiple timeframe analysis for confirmation
- Don't rely solely on any single component
## Technical Notes
- Built for TradingView using Pine Script v5
- Compatible with all timeframes
- Optimized for real-time calculation
- Includes proper error handling and NA value management
- Memory-efficient calculations for smooth performance
## Installation
1. Copy the provided Pine Script code
2. Open TradingView Chart
3. Create New Indicator -> Pine Editor
4. Paste the code and click "Add to Chart"
5. Adjust settings as needed through the indicator settings panel
## Version Information
- Version: 2.0
- Last Updated: November 2024
- Platform: TradingView
- Language: Pine Script v5

RSI Overbought/Oversold + Divergence IndicatorDESCRIPTION:
This script combines the Relative Strength Index ( RSI ), Moving Average and Divergence indicator to make a better decision when to enter or exit a trade.
- The Moving Average line (MA) has been made hidden by default but enhanced with an RSIMA cloud.
- When the RSI is above the selected MA it turns into green and when the RSI is below the select MA it turns into red.
- When the RSI is moving into the Overbought or Oversold area, some highlighted areas will appear.
- When some divergences or hidden divergences are detected an extra indication will be highlighted.
- When the divergence appear in the Overbought or Oversold area the more weight it give to make a decision.
- The same color pallet has been used as the default candlestick colors so it looks familiar.
HOW TO USE:
The prerequisite is that we have some knowledge about the Elliot Wave Theory, the Fibonacci Retracement and the Fibonacci Extension tools.
Wave 1
(1) When we receive some buy signals we wait until we receive some extra indications.
(2) On the RSI Overbought/Oversold + Divergence Indicator we can see a Bullish Divergence and our RSI is changing from red to green ( RSI is higher then the MA).
(3) If we are getting here into the trade then we need to use a stop loss. We put our stop loss 1 a 2 pips just below the lowest wick. We also invest maximum 50% of the total amount we want to invest.
Wave 2
(4) Now we wait until we see a clear reversal and here we starting to use the Fibonacci Retracement tool. We draw a line from the lowest point of wave(1) till the highest point of wave (1). When we are retraced till the 0.618 fib also called the golden ratio we check again the RSI Overbought/Oversold + Divergence Indicator. When we see a reversal we do our second buy. We set again a stop loss just below the lowest wick (this is the yellow line on the chart). We also move the stop loss we have set in step (3) to this level.
Wave 3
(5) To identify how far the uptrend can go we need to use the Fibonacci Extension tool. We draw a line from the lowest point of wave(1) till the highest point of wave (1) and draw it back to the lowest point of wave (2). Wave (3) is most of the time the longest wave and can go till it has reached the 1.618 or 2.618 fib. On the 1.618 we can take some profit. If we don't want to sell we move our stop loss to the 1 fib line (yellow line on the chart).
(6) We wait until we see a clear reversal on the Overbought/Oversold + Divergence Indicator and sell 33% to 50% of our investment.
Wave 4
(7) Now we wait again until we see a clear reversal and here we starting to use the Fibonacci Retracement tool. We draw a line from the lowest point of wave(2) till the highest point of wave (3). When we are retraced till the 0.618 fib also called the golden ratio we check again the RSI Overbought/Oversold + Divergence Indicator. When we see a reversal we buy again. We set again a stop loss just below the lowest wick (this is the yellow line on the chart).
(8) If we bought at the first reversal ours stop los was triggered (9) and we got out of the trade.
(9) If we did not bought at step (7) because our candle did not hit the 0.618 fib or we got stopped out of the trade we buy again at the reversal.
Wave 5
(10) To identify how far the uptrend can go we need to use the Fibonacci Extension tool. We draw a line from the lowest point of wave(2) till the highest point of wave (3) and draw it back to the lowest point of wave (4). Most of the time wave 5 goes up till it has reached the 1 fib. And that is the point where we got out of the trade with all of our investment. In this trade we got out of the trade a bit earlier. We received the sell signals and got a reversal on the Overbought/Oversold + Divergence Indicator.
We are hoping you learned something so you can make better decisions when to get into or out of a trade.
If you have any question just drop it into the comments below.
FEATURES:
• You can show/hide the RSI .
• You can show/hide the MA.
• You can show/hide the lRSIMA cloud.
• You can show/hide the Stoch RSI cloud.
• You can show/hide and adjust the Overbought and Oversold zones.
• You can show/hide and adjust the Overbought Extended and Oversold Extended zones.
• You can show/hide the Overbought and Oversold highlighted zones.
• Etc...
HOW TO GET ACCESS TO THE SCRIPT:
• Favorite the script and add it to your chart.
REMARKS:
• This advice is NOT financial advice.
• We do not provide personal investment advice and we are not a qualified licensed investment advisor.
• All information found here, including any ideas, opinions, views, predictions, forecasts, commentaries, suggestions, or stock picks, expressed or implied herein, are for informational, entertainment or educational purposes only and should not be construed as personal investment advice.
• We will not and cannot be held liable for any actions you take as a result of anything you read here.
• We only provide this information to help you make a better decision.
• While the information provided is believed to be accurate, it may include errors or inaccuracies.
Good Luck and have fun,
The CryptoSignalScanner Team

Musashi_Fractal_Dimension === Musashi-Fractal-Dimension ===
This tool is part of my research on the fractal nature of the markets and understanding the relation between fractal dimension and chaos theory.
To take full advantage of this indicator, you need to incorporate some principles and concepts:
- Traditional Technical Analysis is linear and Euclidean, which makes very difficult its modeling.
- Linear techniques cannot quantify non-linear behavior
- Is it possible to measure accurately a wave or the surface of a mountain with a simple ruler?
- Fractals quantify what Euclidean Geometry can’t, they measure chaos, as they identify order in apparent randomness.
- Remember: Chaos is order disguised as randomness.
- Chaos is the study of unstable aperiodic behavior in deterministic non-linear dynamic systems
- Order and randomness can coexist, allowing predictability.
- There is a reason why Fractal Dimension was invented, we had no way of measuring fractal-based structures.
- Benoit Mandelbrot used to explain it by asking: How do we measure the coast of Great Britain?
- An easy way of getting the need of a dimension in between is looking at the Koch snowflake.
- Market prices tend to seek natural levels of ranges of balance. These levels can be described as attractors and are determinant.
Fractal Dimension Index ('FDI')
Determines the persistence or anti-persistence of a market.
- A persistent market follows a market trend. An anti-persistent market results in substantial volatility around the trend (with a low r2), and is more vulnerable to price reversals
- An easy way to see this is to think that fractal dimension measures what is in between mainstream dimensions. These are:
- One dimension: a line
- Two dimensions: a square
- Three dimensions: a cube.
--> This will hint you that at certain moment, if the market has a Fractal Dimension of 1.25 (which is low), the market is behaving more “line-like”, while if the market has a high Fractal Dimension, it could be interpreted as “square-like”.
- 'FDI' is trend agnostic, which means that doesn't consider trend. This makes it super useful as gives you clean information about the market without trying to include trend stuff.
Question: If we have a game where you must choose between two options.
1. a horizontal line
2. a vertical line.
Each iteration a Horizontal Line or a Square will appear as continuation of a figure. If it that iteration shows a square and you bet vertical you win, same as if it is horizontal and it is a line.
- Wouldn’t be useful to know that Fractal dimension is 1.8? This will hint square. In the markets you can use 'FD' to filter mean-reversal signals like Bollinger bands, stochastics, Regular RSI divergences, etc.
- Wouldn’t be useful to know that Fractal dimension is 1.2? This will hint Line. In the markets you can use 'FD' to confirm trend following strategies like Moving averages, MACD, Hidden RSI divergences.
Calculation method:
Fractal dimension is obtained from the ‘hurst exponent’.
'FDI' = 2 - 'Hurst Exponent'
Musashi version of the Classic 'OG' Fractal Dimension Index ('FDI')
- By default, you get 3 fast 'FDI's (11,12,13) + 1 Slow 'FDI' (21), their interaction gives useful information.
- Fast 'FDI' cross will give you gray or red dots while Slow 'FDI' cross with the slowest of the fast 'FDI's will give white and orange dots. This are great to early spot trend beginnings or trend ends.
- A baseline (purple) is also provided, this is calculated using a 21 period Bollinger bands with 1.618 'SD', once calculated, you just take midpoint, this is the 'TDI's (Traders Dynamic Index) way. The indicator will print purple dots when Slow 'FDI' and baseline crosses, I see them as Short-Term cycle changes.
- Negative slope 'FDI' means trending asset.
- Positive most of the times hints correction, but if it got overextended it might hint a rocket-shot.
TDI Ranges:
- 'FDI' between 1.0≤ 'FDI' ≤1.4 will confirm trend following continuation signals.
- 'FDI' between 1.6≥ 'FDI' ≥2.0 will confirm reversal signals.
- 'FDI' == 1.5 hints a random unpredictable market.
Fractal Attractors
- As you must know, fractals tend orbit certain spots, this are named Attractors, this happens with any fractal behavior. The market of course also shows them, in form of Support & Resistance, Supply Demand, etc. It’s obvious they are there, but now we understand that they’re not linear, as the market is fractal, so simple trendline might not be the best tool to model this.
- I’ve noticed that when the Musashi version of the 'FDI' indicator start making a cluster of multicolor dots, this end up being an attractor, I tend to draw a rectangle as that area as price tend to come back (I still researching here).
Extra useful stuff
- Momentum / speed: Included by checking RSI Study in the indicator properties. This will add two RSI’s (9 and a 7 periods) plus a baseline calculated same way as explained for 'FDI'. This gives accurate short-term trends. It also includes RSI divergences (regular and hidden), deactivate with a simple check in the RSI section of the properties.
- BBWP (Bollinger Bands with Percentile): Efficient way of visualizing volatility as the percentile of Bollinger bands expansion. This line varies color from Iced blue when low volatility and magma red when high. By default, comes with the High vols deactivated for better view of 'FDI' and RSI while all studies are included. DDWP is trend agnostic, just like 'FDI', which make it very clean at providing information.
- Ultra Slow 'FDI': I noticed that while using BBWP and RSI, the indicator gets overcrowded, so there is the possibility of adding only one 'FDI' + its baseline.
Final Note: I’ve shown you few ways of using this indicator, please backtest before using in real trading. As you know trading is more about risk and trade management than the strategy used. This still a work in progress, I really hope you find value out of it. I use it combination with a tool named “Musashi_Katana” (also found in TradingView).
Best!
Musashi

MACD Divergence Fast by RSUAdvantages:
1. When MACD-diff line(orange color) is at a high point, once it falls by 1 k line, it will detect the divergence from the previous high point. This can quickly find the divergence that has taken effect and help you quickly capture the trend before a sharp decline or rise.
2. This indicator detects the previous high and the previous low of 5, 10, 20, 40, 60 lengths at the same time, instead of only detecting a fixed length, so that more divergences can be found.
Notice:
Because it is a quick divergence detection, it is recommended to confirm that the divergence takes effect after the current k is completely closed first. I have identified this state in the indicator as "k not end".
Disadvantages and Risks:
Since it is a quick discovery, there will be error identification. Error divergences will recolor to grey.
Suggestion:
Use “RSI Divergence Fast by RSU” at the same time, because RSI divergence usually occurs before macd, if the position diverges at the same time, the probability of success will increase.
Please do not:
Don't go short in the uptrend, don't go long in the downtrend.
Top divergences that occur because of a strong uptrend are usually only temporary pullbacks. Bottom divergences in persistent declines are also temporary rallies. Do not attempt to trade such low-return trades.
It is recommended to use the divergence indicator when the stock price has made a new high and retraced, and once again made a new high, because this often leads to the end of the trend.
Divergence how to use:
1. After the previous K line was completely closed, a bottom divergence was found.
2. Open an long order at the beginning of the second bar, or as close to the bottom as possible (because the stop loss will be smaller).
3. Break the stop loss price below the previous low where the divergence occurred, which already means that the divergence is wrong.
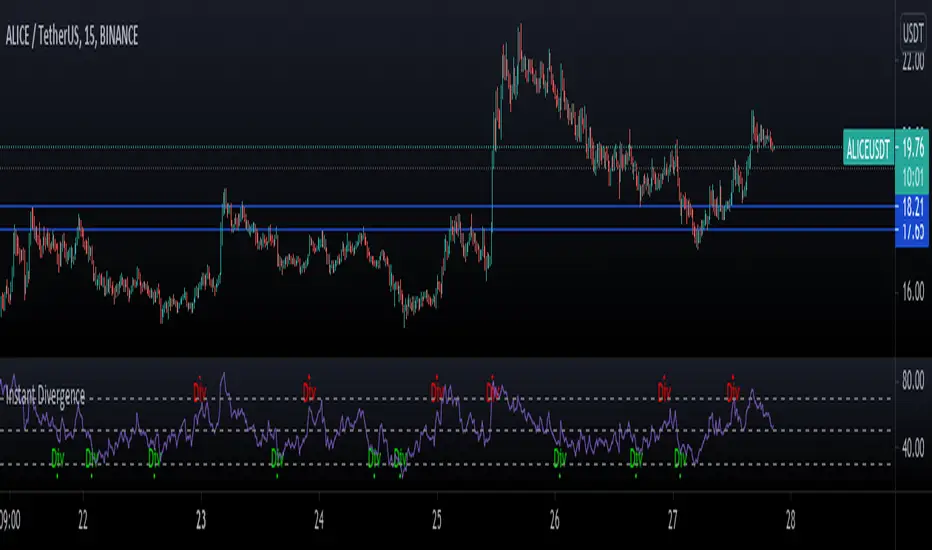
Instant RSI DivergenceThis script uses RSI Highs and Lows along with measuring price actions Highs and lows to find Divergences instantly.
The common problem when doing this is that you end up with signals all over the place if you dont use the pivot finder as confirmation however I have found a way to avoid this problem.
Since there extra bars to confirm whether price are making pivot highs or not, you can end up with some signals which are invalidated a few bars later.
The Green Divs are showing Bullish divergence and the Red Divs are showing bearish divergence.
You can use this with other indicators to mark up more levels of confluence to confirm trade entries.
™TʀᴀᴅᴇCʜᴀʀᴛɪsᴛ Tʀᴇɴᴅsᴇᴛᴛᴇʀ™TradeChartist Trendsetter is an elegantly designed functional indicator that helps spot price trends based on user input and volatility to generate high probability BUY and SELL signals.
1. What does ™TradeChartist Trendsetter do?
Plots high probability BUY/SELL signals based on user input and price volatility.
Plots recommended Stop Loss and SOS signals.
Plots regular RSI divergences based on user input.
Plots Linear Regression trend lines based on user input.
Displays Trendsetter Dashboard with useful trade information.
Displays real time gains tracker.
Tracks another symbol on Dashboard based on user input.
Alerts when BUY and SELL signals are generated.
2. What markets can this indicator be used on?
Forex
Stocks - Signal prices calculated taking gaps into account.
Commodities
Cryptocurrencies
and almost any asset on Trading View.
Works really well when there is good volume, volatility or both in the asset traded/observed.
3. Do the indicator signals repaint?
No. Once the BUY and SELL signals are generated with entry price (open price of signal candle), there is no repainting.
This can be verified using Trading View Bar Replay to check if the signals stay in the same candle in real-time as the Bar Replay.
4. Does the indicator send alerts when a signal is generated?
Yes. Traders can get alerts by setting up Trading View alerts for BUY/SELL signals. For confirmed BUY/SELL alerts, 'Once Per Bar' must be used as there is no need to wait for the candle close.
Example Charts
GBP-USD 1hr chart with indicator plots description
GOLD 4hr chart using Daily HTF resolution from indicator settings.
SPX 15m chart using Daily HTF resolution with RSI divergences.
Note: Default settings work really well for most assets and time frames. Change HTF resolution (default 4hr) from indicator settings and make sure it is higher time frame than the chart resolution.

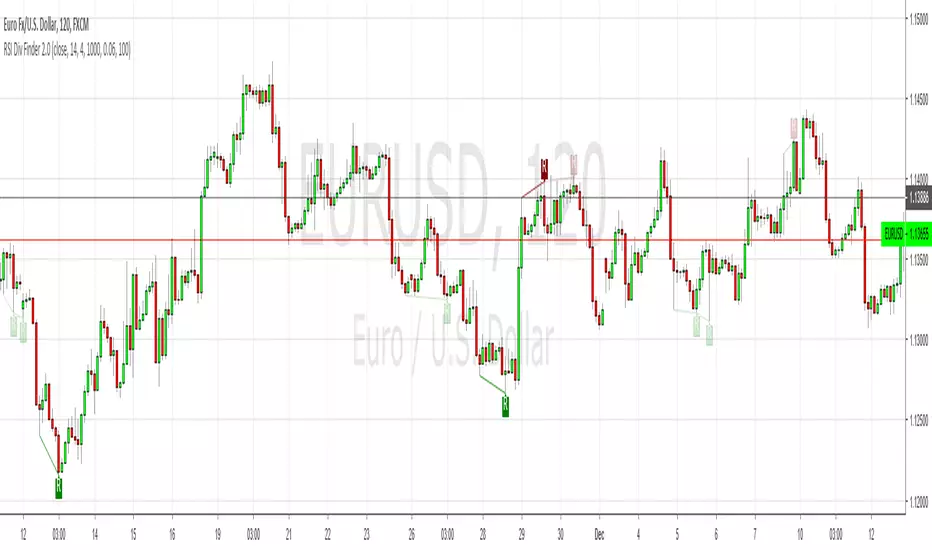
Filtered RSI Divergence Finder Check the settings to see how the filters work. I added alerts and a feature that shows the divergences that have been filtered, but as faded "ghost" divergences. Spooooky. This is useful for tuning the script to a particular market. All credit to RicardoSantos for the original.
Divergence TraderThe indicator catches the regular and hidden divergences on indicators like RSI, CCI and Williams %R. It is possible to select the indicator to be used for catching the divergences and multiple selection is possible. The script not only runs on Crypto trading but also Forex or DXY and EXY along with. The signal type can be selected as "Long/Short" or "Buy/Sell". Since the divergence does not occur sequentially, same signal may appear after the signal. There is no repaint, as the signal appears on the newly opened candle and it means the conditions are met and signal is solid to follow from the beginning time of candle. Besides, confirmations can be set for previous candle's high/low, previous candle's green or red, High/Low Doji or Body Doji candles. Doji sensibility can be set separately. There are 2 divergence calculation mode, each has to be used separately as they effect's calculation parameters differently. Alarms are defined in the indicator as again Long, Short, Buy or Sell.
Along with all of these, the entry point confirmations can be set as in indicators (ie. CCI has to be over 100 when Long condition met.) The confirmation code works separately from the divergence indicators so there is no need to use CCI divergence for confirmation. However, both divergence and confirmation source and length are the same.
The indicator does not depend on intervals. It focuses directly to divergences on the indicators.
Roadmap:
- MACD divergence integration
- Stoch RSI divergence integration
- Seperation of indicator confirmation modules and divergence base indicators in terms of length and source
- Implementation of exaggerated divergences

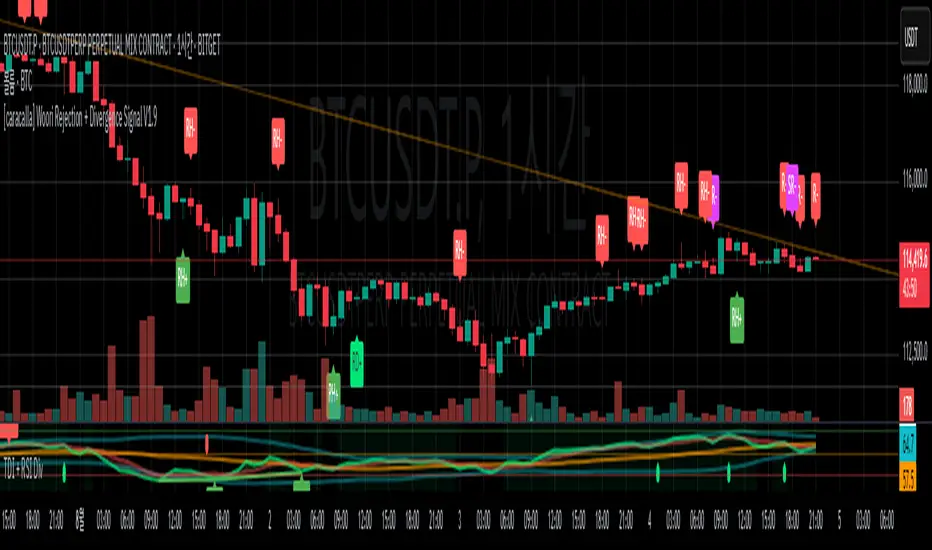
[caracalla] Woori Rejection + Divergence Signal V1.6📌 지표 개요 | Indicator Overview
KR
이 스크립트는 리젝션 패턴과 RSI 다이버전스를 활용해 매수(R+)·매도(R-) 반전 신호를 생성합니다. 특히 일반 다이버전스(RD+, RD-)를 히든 다이버전스(RH+, RH-)보다 우선 표시하며, 과매도/과매수 조건도 실전 트레이딩에 맞게 유연하게 조정되어 있습니다.
EN
This script generates buy (R+) and sell (R−) reversal signals by combining rejection candlestick patterns and RSI divergences. It prioritizes regular divergence signals (RD+/RD−) over hidden ones (RH+/RH−), with relaxed overbought/oversold RSI conditions to better suit real trading environments.
🔍 리젝션 조건 | Rejection Conditions
KR
R+: 이전 음봉 후 양봉 전환, 아래꼬리가 몸통보다 길며 RSI < 45
R-: 이전 양봉 후 음봉 전환이거나 긴 위꼬리 음봉, RSI > 50
도지 캔들은 제외되며, 꼬리 길이 비중이 중요한 요소로 작용
EN
R+: Bullish rejection after a bearish candle, long lower wick, RSI < 45
R-: Bearish rejection after bullish candle or long upper wick, RSI > 50
Doji candles are filtered out; long wick length relative to body is essential.
⚙️ 다이버전스 감지 | Divergence Detection
✅ 일반 다이버전스 | Regular Divergence (RD+/RD−)
KR
RD+: 가격 저점 하락 + RSI 저점 상승 + 리젝션
RD-: 가격 고점 상승 + RSI 고점 하락 + 리젝션
EN
RD+: Price makes lower lows, RSI makes higher lows, with rejection
RD−: Price makes higher highs, RSI makes lower highs, with rejection
✅ 히든 다이버전스 | Hidden Divergence (RH+/RH−)
KR
RH+: 가격 저점 상승 + RSI 저점 하락 + 리젝션
RH-: 가격 고점 하락 + RSI 고점 상승 + 리젝션
EN
RH+: Price makes higher lows, RSI makes lower lows, with rejection
RH−: Price makes lower highs, RSI makes higher highs, with rejection
🧠 시그널 우선순위 | Signal Priority
KR
동일한 캔들에서 일반 다이버전스와 히든 다이버전스가 동시에 발생해도, **일반 다이버전스(RD+, RD−)**가 **히든 다이버전스(RH+, RH−)**보다 우선 표시됩니다.
EN
When both regular and hidden divergence conditions are met on the same candle, regular divergence (RD+, RD−) is prioritized over hidden divergence (RH+, RH−).
🔔 알림 기능 | Alert System
KR
모든 시그널(R+, R-, RD+, RD-, RH+, RH-)에 대해 알림 설정이 포함되어 있어, 자동매매나 실시간 대응이 가능합니다.
EN
Alert conditions are included for all signals (R+, R-, RD+, RD-, RH+, RH-), enabling automation or real-time trading reactions.
Apex Edge – Super RSIThe Apex Edge – Super RSI is not your average RSI. This is an institutional-grade signal engine designed for serious traders who want confluence, control, and confidence — all wrapped into one visual powerhouse.
━━━━━━━━━━━━━━━━━━━━
KEY FEATURES
━━━━━━━━━━━━━━━━━━━━
✔ **RSI + Divergence Engine**
• Classic & Hidden Divergences (auto-detected)
• Labelled with shapes:
▲ Green Triangle – Buy Signal (strength-based size)
▼ Red Triangle – Sell Signal
◆ Green Diamond – Classic Bullish Divergence
◆ Red Diamond – Classic Bearish Divergence
● Green Circle – Hidden Bullish Divergence
● Red Circle – Hidden Bearish Divergence
Note - Users can edit symbol colours in settings for better clarity
✔ **Trap Detection System**
• Detects low-move, high-signal clusters (liquidity traps)
• Automatically suppresses signals for X bars after detection
• Trap zones shown with shaded background (optional)
✔ **Signal Scoring Logic**
• Each signal is scored 1–6 based on:
• RSI Threshold Break
• RSI Slope
• Divergence Detected
• Trap Avoidance
• Multi-Timeframe Confluence (optional)
• The plotted shape size reflects the strength of the entry signal
✔ **Multi-Timeframe Confluence (MTF)**
• Optional filter that uses HTF and VHTF RSI alignment
• Prevents countertrend signals
• MTF Bias shown on HUD panel
✔ **Always-On HUD Panel**
• Displays:
• Signal Type
• Signal Score
• Divergence Type
• RSI (LTF & HTF)
• Trap & Cooldown Status
• MTF Bias
• Volatility %
✔ **Alert Ready**
• Buy/Sell alerts
• Trap Detected alert
• Divergence alert with dynamic message
• Perfect for webhook integrations
━━━━━━━━━━━━━━━━━━━━
📘 HOW TO TRADE IT
━━━━━━━━━━━━━━━━━━━━
✅ **Buy Setup**
• Green triangle (▲) appears **below bar**
• RSI is oversold and rising
• HTF RSI agrees (optional)
• Signal score is 3+ for best confidence
• Avoid signals during cooldown zone
✅ **Sell Setup**
• Red triangle (▼) appears **above bar**
• RSI is overbought and falling
• HTF RSI agrees (optional)
• Signal score is 3+ for best confidence
✅ **Divergences**
• Use diamonds/circles to identify momentum shifts
• Strongest when aligned with score 4–6
❗**Trap Zones**
• When background is shaded, wait for cooldown
• Signals during traps are suppressed for safety
━━━━━━━━━━━━━━━━━━━━
📊 BEST USED WITH
━━━━━━━━━━━━━━━━━━━━
🔹 Apex Edge – Session Sweep Pro (to visualize liquidity levels)
🔹 Volume Profile or OBV (volume-based confirmation)
🔹 EMA Ribbon (for trend alignment)
🔹 Fair Value Gap indicator (smart money models)
━━━━━━━━━━━━━━━━━━━━
🧠 PRO TIPS
━━━━━━━━━━━━━━━━━━━━
• Use the HUD for decision confidence — if everything aligns, you’ve got an Apex-grade setup.
• Wait for candle close to confirm divergence-based entries.
• Score 5–6 = sniper entries. Score 1–2 = warning shots.
This indicator can be used alongside Apex Edge Session Sweep Pro for better visual clarity.
━━━━━━━━━━━━━━━━━━━━
© Apex Edge | All rights reserved.
3 days ago
Release Notes
Update - Added a toggle to show/hide HUD when using on smaller mobile devices so as not to clutter the screen.

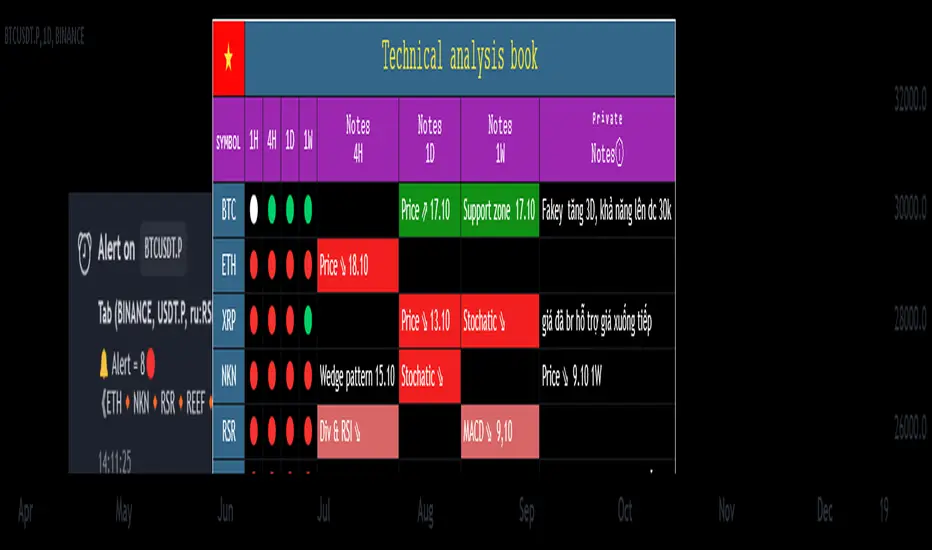
Technical Analysis Notes👉 Hello trader.
- In the process of monitoring the list of trading pairs such as stocks, cryptocurrencies... I often mark signals such as: RSI divergence, MACD, Stochatic, RSI trendline, Trendline..."by hand" , like recording on a drawing board, or excell, notepad... Therefore, taking notes is very limited. In addition, each time frame gives different, inconsistent signals and it is difficult to analyze the trend of a trading pair. somehow.
- After a period of careful research, I created the "Technical Analysis notes" indicator to solve the problems mentioned above, and after using it, I personally found it very effective to mark it. Trading signals as well as trend analysis across time frames from small to large.
- For example: On weekends, I often use automatic scanning indicators (about 200 codes) RSI divergence, RSI trendline, Trendlines, MACD-histogram .. within a week, then mark trading pairs when there are signals. Signals such as RSI cutting its trend line, price breaking through the trend line, Histogram MACD divergence... in the weekly frame, from there look to the D1, H4 frames to see the next signals in those frames to find the direction of intersection. Move in the same direction as the weekly frame signal to trade in the same trend. From that analysis, I limit my ability to go against the trend, and wait patiently for the signals that have been noted before.
- On this board you can monitor 10 transaction codes (in real time)
- On this table I have given 4 different time frames (can be customized in settings)
- I add Kumo Cloud (ichimoku) signals on 4 time frames so that people can easily recognize the trend when the price is above the cloud (green circle), in the cloud (white circle), below the cloud (green circle). red circle)
- I add fast typing mode, shortcut typing depending on each person's description including 16 fast typing modes (for example: "ru:RSI br up" in my understanding means the RSI line has broken above the trend line direction)
- From the above example "ru:RSI br up" the sign ' : ' is the separator that must be present to interpret the word 'ru' as being typed quickly, and 'RSI br up' is the part that explains the content of that word typed quickly.
- In those 16 quick typing boxes (divided into 4 rows), the first 3 rows are colored with custom boxes for each person. The last remaining row is not filled.
- The content of note boxes can be hidden in the settings using the check box.
- In particular, the private notes column cannot be hidden, because it is the column for recording, synthesizing, analyzing, identifying main trends, or waiting points to place orders... (This box is the most important in my opinion. ..)
- Has a super smart warning mode (customizable) when Kumo cloud signals are in the same color on 4 time frames for the most certain trend (green - bullish, red - bearish)
- In the warning section, you can adjust from 4 time frames to 3 time frames, 2 time frames, 1 time frame.
- Alert mode lists exact code names when one or more codes qualify. (eg BTC, ADA, BNB...)
--------------------------------------------------------------------------------------------------------------------
👉 Vietnamess
- Trong quá trình theo dõi danh sách các cặp giao dịch như cổ phiếu, tiền điện tử...tôi thường đánh dấu các tín hiệu như : phân kì RSI, MACD, Stochatic, trendline RSI, Trendline ..."bằng tay", như ghi trên bảng vẽ, hoặc excell, notepad...Vì vậy ghi chép rất hạn chế ngoài ra mỗi khung thời gian cho các tín hiệu khác nhau, không đồng nhất và rất khó để phân tích xu hướng của một cặp giao dịch nào đó.
- Sau một thời gian nghiên cứu kĩ lưỡng tôi có lập lên được chỉ báo "ghi chép Phân tích kĩ thuật " nhằm giải quyết các vấn đề nêu như trên, và sau quá trình dùng, cá nhân tôi thấy rất hiệu quả khi đánh dấu các tín hiệu giao dịch cũng như phân tích xu hướng qua các khung thời gian từ nhỏ đến lớn.
- Ví dụ: Cuối tuần tôi thường dùng chỉ báo quét tự động(khoảng 200 mã) RSI phân kì, RSI trendline, Trendlines , MACD-histogram .. trong khung 1 tuần, sau đó đánh dấu những cặp giao dịch khi có những tín hiệu như RSI cắt đường xu hướng của nó, giá đột phá đường xu hướng, phân kì Histogram MACD.. trong khung tuần, từ đó tìm đến những khung D1,H4 xem các tín hiệu tiếp theo trong các khung đó để tìm hướng giao dịch cùng hướng với tín hiệu khung tuần để giao dịch cùng xu hướng. Từ những phân tích đó tôi hạn chế được đi ngược xu hướng, và kiên nhẫn chờ đợi khi có tín hiệu được đã ghi chú từ trước.
- Trên bảng này có thể theo õi được 10 mã giao dịch(theo thời gian thực)
- Trên bảng này tôi có đưa ra 4 khung thời gian khác nhau(có thể tùy chỉnh trong thiết lập)
- Tôi đưa thêm tín hiệu Mây Kumo( ichimoku) trên 4 khung thời gian để mọi người từ đó dễ dàng nhận biết xu hướng khi giá trên mây(dấu tròn xanh lá) , trong mây(dấu tròn trắng) , dưới mây(dấu tròn đỏ)
- Tôi đưa thêm chế độ gõ nhanh, gõ tắt tùy theo diễn tả của mỗi người gồm 16 chế độ gõ nhanh (ví dụ: "ru:RSI br up" theo ý hiểu của tôi là đường RSI đã phá vỡ lên trên đường xu hướng)
- Từ ví dụ trên "ru:RSI br up" dấu ' : ' là ngăn cách phải có để diễn giải từ 'ru' là gõ nhanh, còn 'RSI br up' là phần diễn giải nội dung của từ gõ nhanh đó
- Trong 16 ô gõ nhanh đó(được chia làm 4 hàng) có 3 hàng đầu được tô màu ô tùy chỉnh cầu mỗi người. hàng cuối cùng còn lại không được tô.
- Nội dung các ô ghi chú có thể được ẩn hiện trong mục cài đặt bằng ô dấu tích.
- Đặc biệt cột ghi chú riêng tư không ẩn được, vì đó là cột ghi chép, tổng hợp , phân tích , nhận định xu hướng chính, hay điểm chờ để đặt lệnh...(ô này theo tôi là quan trọng nhất...)
- Có chế độ cảnh báo siêu thông minh(có thể tùy chỉnh) khi tín hiệu mây Kumo cùng trên 4 khung thời gian cùng màu cho xu hướng chắc chắn nhất(xanh- tăng giá, đỏ- giảm giá)
- Trong mục cảnh báo có thể điều chỉnh từ 4 khung thời gian xuống còn 3 khung thời gian, 2 khung thời gian, 1 khung thời gian.
- Chế độ cảnh báo được liệt kê tên mã chính xác khi một hay nhiều mã đủ điều kiện .(ví dụ BTC , ADA , BNB...)